
The bane of any momentum portfolio is slippage. You might see a particular return being displayed by the system but when you actually go and run it yourself with real money you find that you are not getting the returns. And at times, it is not even close to what the system promises.
Returns lag due to many reasons. High cost of brokerage and transaction costs is one. This is why we always suggest using discount brokers to keep costs as low as possible. Slippage is also another major concern. Especially for "breakout momentum" systems. We do not use a breakout momentum system precisely because of this reason.
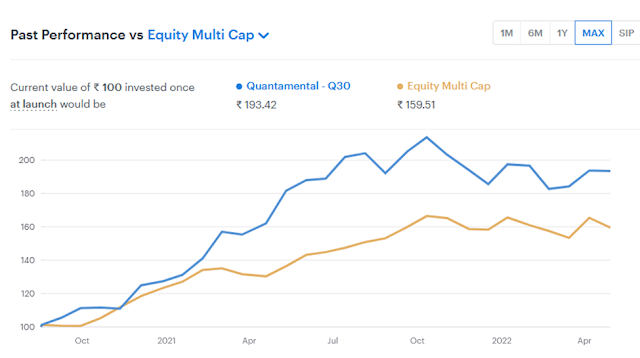
Are these returns real? We have often been asked this question. But first some context. Q30 was launched on 28th Feb 2020 (2 years and 2 months) and has been live on the Smallcase platform since 17th Aug 2020 (1 year 8 months). We were using our own model portfolio sheet to calculate and report returns till Aug 20 and switched to reporting returns based on smallcase provided numbers from thereon, as it is a reliable third party and we can’t report inaccurate numbers even by mistake.
Smallcase so far was taking prices of stocks on the day of upload of rebalances, whereas subscribers were buying and selling on the next trading day and there was a lingering doubt in our minds as to how much is the loss due to slippage and how different is the actual returns for investors compared to the model portfolio.
Smallcase has made changes to their method and now it will now take prices as on the day when it is available for action by users. It would also take the average of OHLC (open high low and closing prices) so that price is fairly representative of actual user transacted prices during the day.
The CAGR numbers that you see below are now based on prices on the day when rebalance was available for users to execute. Since 17th August 20, Q30 CAGR is ~47%. This is after taking into account slippage. And it has beaten the benchmarks by a huge margin.
But what about brokerage? How much is being lost in churn due to brokerage?
Starting with 10 lakhs on 17th Aug 20, the capital has compounded at ~46% CAGR in the last 1 year 8 months post all slippage, brokerage and advisory fees. Few conclusions
1. Annualized brokerage comes to about 1.6% well within 2% estimates we have communicated based on our churn %
2. Advisory fee comes to less than 1% annualized. Of course, this would be lower if higher capital is invested and higher if much smaller capital is invested. But it does give you a very clean and clear perspective of what the actual scenario is.
1. Q30 is one of the lowest slippage portfolios around.
2. Doubts on post slippage and post brokerage returns have been laid to rest with change in returns calculation methodology.
3. Over longer rolling periods we expect Q30 to perform better than the market and provide reasonable returns with minimal effort (less than 15 mins a month).
Next week we will look into similar data for Q10.
No comments:
Post a Comment